Primary Sources The documents themselves, cited. Published Wednesdays.
Published inputs, an unpublished model, and one number
A closure decision rested on a projection of 1,010 students at three schools in 2039. The three input series behind that figure are named in public.
Closing a school requires a view of how many children will want one in fifteen years. That view arrived as a single number: 1,010 students at three schools in 2039. Where its ingredients came from is public. How they were combined is not.
The number, and what it was used to support.
Three schools were named as receiving schools when a Vancouver elementary school was closed. The information session slides of 28 October 2025 give each of them a current enrolment and a projection for 20391.
| School | Enrolment 2024-25 | Projected 2039 | Change |
|---|---|---|---|
| Cunningham | 428 | 408 | −20 |
| Weir | 379 | 318 | −61 |
| MacCorkindale | 294 | 284 | −10 |
| Total | 1,101 | 1,010 | −91 |
The three together are projected to fall by 91 students, which is 8.3 per cent of the 2024-25 figure2. Over the fourteen years from 2025 to 2039 that is an average of about 0.6 per cent a year3. Staff stated that the three schools “are projected to be able to accommodate the projected student enrolment for the next 14 years”1.
Against the combined operating capacity of the three, 1,463, the 2039 projection sits at 69.0 per cent4. The two capacity figures published for these schools, and the difference between them, were set out separately in this series5. What this piece follows is the projection itself.
Where a participation rate sits in a method like this.
A projection of this kind moves in stages. Births in a geography become resident children of school age. Some share of those children enrol in the local public school rather than in an independent school, a programme elsewhere, or another district. That share is what planners call a participation or capture rate, and it converts a population into a roll.
The quantity is named on the face of the record. The Facilities Planning Committee report of 16 June 2025 describes the district’s inputs running through a “Population-Based Participation Rate Model”6.
So the rate carries a name on the record. It sits in the title of the model that produces the number a closure decision rested on. What the records read do not contain is its value, at any school, in any year.
What the record publishes.
The producer is named: Baragar Systems, an external vendor, with district “local knowledge” added. The district’s published material names the “Baragar Plus Local Knowledge model (projections currently to 2039)”, and the Engagement Summary of 10 December 2025 states that “Baragar plus local knowledge projections only extend to 15 years into the future”7.
The inputs are named. The 16 June 2025 report lists “actual enrolment reports, the birth registry from Vital Statistics BC, and the Canada Child Benefit (CCB) recipient data”. The report is authored by Jessie Gresley-Jones, Executive Director of Facilities, and James de Hoop, Senior Manager of Planning6.
Each of the three input series has a public custodian. Enrolment reports are the district’s own. The birth registry belongs to Vital Statistics BC. Canada Child Benefit recipient data is federal. A reader can identify all three and, with the usual access work, obtain versions of them.
What the record withholds.
Baragar is proprietary software, and no algorithm, no parameter set and no reproducible specification appears in the records read. The participation rate does not appear as a value. The “local knowledge” adjustment is stated to be applied, and the records read do not state what it changed, at which school, or in which direction6.
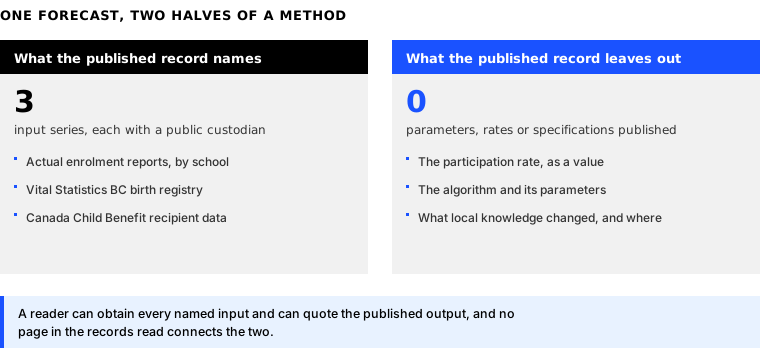
The consequence is direct: a second analyst holding all three named input series can produce a projection. They cannot produce this projection, and no published page tells them how far apart the two results should be expected to sit.
That is one of the open questions this series carries. On the published record, the answer to whether the 2039 figures can be reproduced from published inputs appears to be no.
Five sets, and none of them states a rate.
The same 16 June 2025 report presents five projection sets side by side: Baragar Baseline of November 2024, Baragar with Local Knowledge Added of April 2025, BC Stats of February 2025, the Ministry set of December 2024, and Metro Vancouver of March 20246. The record used in the closure cycle is the Baragar plus local knowledge set, which is the one running to 20397. The horizons those sets cover, and how they sit against the district’s published plan, were counted on 2 September8.
Each of the five embeds an assumption about how many resident children become enrolled students. None of the five publishes that assumption as a number in the records read. Five sets from four producers therefore give a reader five outputs and no way to locate where they diverge.
Why the rate matters more than the total.
A total moves for two reasons that look identical on a page. Fewer children in the catchment, or the same children choosing differently.
Those two causes point in opposite directions for planning. A falling child population and a falling share enrolling in the local public school produce the same projection, and they call for different responses9. Nothing in the published output distinguishes them, because the rate that separates them is inside the model.
This matters for land in particular. A projection is revisited each year. A decision about a site is revisited on a much longer cycle, and some of those decisions are not revisited at all. Where a projection with an unpublished rate feeds a decision with a long horizon, the assumption travels further than the document that carried it.
What stays open.
Four questions remain unclosed on the published record.
- The capture or participation rate underlying the 2039 estimates, and whether it matches the assumption in the district’s most recent enrolment reporting.
- Whether homes approved or designated under the transit-oriented area designation enter these estimates, at what unit yield and at what number of children per unit.
- Whether a second analyst can reproduce the 2039 figures from the published inputs. Baragar is proprietary, so on the published record the answer appears to be no.
- What reconciliation exists between the district projection and the regional projection the municipal plan relies on for the same ground.
None of the four is a criticism of the projection. Each is a statement about what a reader can check.
What the record establishes, and what it leaves.
It establishes the figures: 1,101 students at the three receiving schools in 2024-25 and 1,010 projected for 2039, a fall of 8.3 per cent over fourteen years. It establishes the producer, the three input series, the name of the modelling approach, the fact that staff adjust the result, and the statement those figures were used to support.
It leaves the algorithm, the parameters, the participation rate and the content of the local adjustment outside the published record. A reader is therefore able to quote the projection accurately and unable to test it, and the difference between those two positions is the whole of this piece.
Four fields beside every published projection.
The model name and version with the date it was run. Each input series with its vintage. The participation or capture rate applied, as a number. And one worked example carrying a single cohort from births in one year to seats in one school in a later year.
None of that discloses proprietary code, and none of it requires a vendor to publish an algorithm. A rate is an output of a model rather than the model itself, and a worked cohort is an illustration rather than a specification. Together they would let a reader reproduce the shape of the calculation, state where their own assumptions differ, and see the size of the difference.
The projection would still be the district’s and the decision would still be the Board’s. What would change is that anyone reading either could say precisely where they part company with it, and why.
Sources
-
Vancouver School Board, Sir Guy Carleton closure information session slides, 28 October 2025. The 2024-25 enrolment and 2039 projection for Cunningham, Weir and MacCorkindale, their operating capacities, and the staff statement that the three schools are projected to accommodate the projected enrolment for the next 14 years. ↩ ↩2
-
Projected decline across the three schools to 2039: 91 students, or 8.3 per cent.
1,101 − 1,010 = 91; 91 ÷ 1,101 = 0.0826, rounded to 8.3 per centThe 2024-25 enrolment total less the 2039 projection total, both quoted from the same slide deck. The per-school movements of 20, 61 and 10 sum to the same figure. It describes the movement in the projection and carries no view about whether the projection is well founded. ↩ -
Average annual rate implied by the projection: about 0.6 per cent a year.
(1,010 ÷ 1,101) raised to the power of 1 ÷ 14 = 0.99386, a fall of 0.61 per cent a yearA constant-rate average across fourteen years, computed from the two published endpoints. The records read publish endpoints rather than a year-by-year path, so the projection is very unlikely to fall at this rate in any given year. It is a way of holding the size of the movement in mind. ↩ -
The 2039 projection against combined operating capacity: 69.0 per cent.
1,010 ÷ 1,463 = 0.6904, rounded to 69.0 per centOperating capacity of 598, 421 and 444 sums to 1,463. Under the Ministry definition operating capacity is adjusted for grade structure and class size, so this denominator can move without any building changing. ↩ -
VTCo, The denominator was bargained, The Split Record, 19 October 2026. The two capacity figures published for these three schools, the Ministry basis for each, and the spread between the two readings. Published twelve days after this piece. ↩
-
Vancouver School Board, Facilities Planning Committee agenda and report, 16 June 2025. Baragar Systems as the producer, the three published input series, the Population-Based Participation Rate Model, the five projection sets and their vintages, the addition of district local knowledge, and the named authors. ↩ ↩2 ↩3 ↩4
-
Vancouver School Board, closure Frequently Asked Questions and Engagement Summary, 10 December 2025. The naming of the Baragar Plus Local Knowledge model with projections currently to 2039, and the statement that those projections extend only fifteen years into the future. ↩ ↩2
-
VTCo, Eight years past the published horizon, Primary Sources, 2 September 2026. The horizons carried by each projection set, the ten-year horizon stated in the district’s published long-range facilities plan, and the distance between that horizon and the 2039 projection used in the closure cycle. ↩
-
Ministry of Education and Child Care, Long-Range Facilities Plan Guidelines, April 2019. The definitions of nominal and operating capacity, and the statement that class sizes are negotiated locally so operating capacities vary between school districts. ↩