Primary Sources The documents themselves, cited. Published Wednesdays.
Eight years past the published horizon
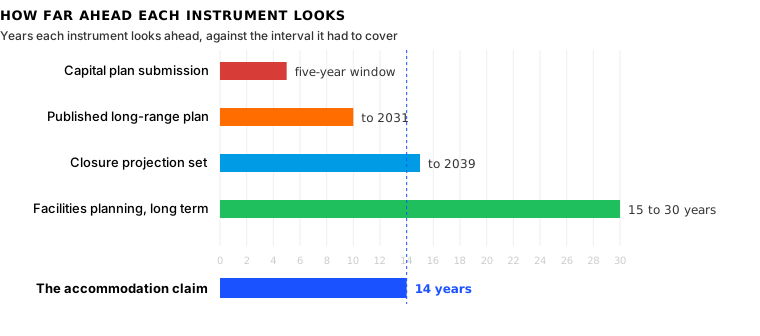
A closure decision was tested against enrolment projections running to 2039. The district's published long-range facilities plan runs to 2031.
A capacity figure does different work in a capital plan and in a closure report, and the instrument it belongs to is rarely printed beside it. This piece follows one figure across that boundary. The accommodation claim behind a closure rests on projections to 2039, and the district’s published long-range facilities plan states a horizon of 2031.
Two instruments, two jobs for one number.
In a capital plan, a capacity figure sizes a request. Renfrew Elementary appears in the Vancouver School Board 2027-2028 Five-Year Capital Plan with a nominal capacity of 760, an operating capacity of 619, an enrolment of 475 in 2025-26 and approximately 144 seats available, attached to a Year 1 seismic mitigation request estimated at $51,838,3151. Those figures are inputs to a queue.
In a closure report, a capacity figure supports an accommodation claim. The three schools identified to receive students from a proposed closure appear in the district’s information session slides of 28 October 2025, each with an operating capacity, a nominal capacity, an enrolment and a projection for 20392. Those figures are inputs to a sufficiency test.
The spread between nominal and operating capacity was read in this series on 19 August3. What follows is a different question: what happens to a capacity figure when it crosses from one instrument into another.
The receiving set, counted.
Cunningham, Weir and MacCorkindale carry the figures below in the 28 October 2025 slides2.
| School | Operating capacity | Nominal capacity | Enrolment, 2024-25 | Projected, 2039 |
|---|---|---|---|---|
| Cunningham | 598 | 660 | 428 | 408 |
| Weir | 421 | 465 | 379 | 318 |
| MacCorkindale | 444 | 490 | 294 | 284 |
| Total 4 | 1,463 | 1,615 | 1,101 | 1,010 |
Operating capacity sits close to nine tenths of nominal at each of the three. That relationship is a property of these three grade structures. No district-wide conversion factor is published, and the relationship carries to no other school, because operating capacity is derived by adjusting nominal capacity for class size and class sizes are settled in local collective agreements5.
The claim the figures carry.
District staff stated that the three schools are projected to be able to accommodate the projected student enrolment for the next 14 years, that is, to 20392.
Against the operating total of 1,463, the current enrolment of 1,101 is 75.3 per cent6. The 2039 projection of 1,010 is 69.0 per cent7. Across that interval the projection declines by 91 places8, 8.3 per cent of the current enrolment.
| Figure | What it is |
|---|---|
| 1,463 | Operating capacity across the three receiving schools. |
| 1,101 | Enrolment across the same three schools, 2024-25. |
| 1,010 | The projection for the same three schools in 2039. |
| 14 years | The period the accommodation claim covers. |
Fourteen years counted from the 2025 information session lands in 20399, which is the projection year the district’s own closure material names. So the claim rests on a projection year, and the projection year is 2039.
Where the horizon comes from.
The district’s current long-range facilities plan is the 2020 Long-Range Facilities Plan, approved by the Board on 25 January 2021. The operative published document is the 2020 Long-Range District Overview, 2021 Update, dated May 2022, with six regional strategies and seventeen appendices10.
That document states its own horizon: the enrolment data is from September 2021 and the enrolment projections are for a ten-year planning horizon to 2031. Some district projections are described as running fifteen years, to 2036. Appendix E is titled School Enrolment Forecasts 2022 to 203110. No newer long-range facilities plan has been published.
The Ministry’s guidelines state that a long-range facilities plan is expected to cover a ten-year timeframe at a minimum5.
The projection set carried into the closure decision runs further. The district’s closure material describes the Baragar plus local knowledge model with projections currently to 2039, and the engagement summary of 10 December 2025 states that the projections extend fifteen years into the future11.
2039 is eight years past 203112.
Five projection sets in one report.
The Facilities Planning Committee report of 16 June 2025, authored by the Executive Director of Facilities and the Senior Manager of Planning, presents five projection sets13.
| Projection set | Producer | Dated |
|---|---|---|
| Baragar Baseline | Baragar Systems | November 2024 |
| Baragar with Local Knowledge Added | Baragar Systems with district input | April 2025 |
| BC Stats | BC Stats | February 2025 |
| MECC | Ministry of Education and Child Care | December 2024 |
| Metro Vancouver | Metro Vancouver | March 2024 |
Five sets, four producers, dated across thirteen months14.
The four producers are the district’s external vendor, a provincial statistics agency, the Ministry of Education and Child Care, and a regional authority. Each set was produced by a different body on its own cycle and for its own purpose, and the report presents them together without stating which one a facilities decision follows13.
The same report sets out the horizons in use. Short term is the next three years. Medium term is a ten to fifteen year horizon. Long term is a fifteen to thirty year horizon, with charts spanning 2033 to 205013.
The published inputs are actual enrolment reports, the birth registry from Vital Statistics BC, and Canada Child Benefit recipient data, run through a population-based participation rate model13. No published record sets out the full technical method. Baragar is proprietary software, and no algorithm, parameter set or reproducible specification appears in the record read.
What the records do not state.
Across the records read for this piece, three statements are absent.
- Which of the five projection sets governs a closure determination, a capital request, or a surplus determination.
- Which capacity figure, nominal or operating, governs each of those determinations.
- How the ten-year horizon published in the long-range facilities plan is reconciled with the fifteen-year projections carried into a closure decision.
Every figure above is published, and each is labelled correctly where it appears. The rule that maps one instrument onto another appears nowhere in the record read. A reader holding a capacity figure from one document and a projection from another has no published basis for deciding whether the two belong on the same page.
A district may reasonably hold several projection sets, and a decision may reasonably rest on the most recent projection available rather than on the horizon of a plan approved in January 2021. It reads the records named above as at 2 September 2026, and records read later would carry later figures.
Three fields beside every capacity and enrolment figure.
Three fields printed beside every capacity and enrolment figure: the instrument it belongs to, the horizon it runs to, and the projection set it came from.
All three already exist inside the district’s own documents. Printing them at the point of use costs nothing and settles which of five sets a reader is holding, which is the question a reader currently cannot answer from the page in front of them.
None of that constrains a decision. A label settles only which of five documents a board is holding when it takes one.
Every figure above carries its source and every calculation is shown. Start with the school nearest you.
The arithmetic behind these figures is shown in Sources.4
Sources
-
Vancouver School Board, 2027-2028 Five-Year Capital Plan and Minor Capital Plan, Facilities Planning Committee, 17 June 2026. Renfrew Elementary at nominal capacity 760, operating capacity 619, enrolment 475 for 2025-26 and approximately 144 seats available, within a Year 1 seismic mitigation request estimated at $51,838,315. ↩
-
Vancouver School Board, Sir Guy Carleton closure information session slides, 28 October 2025. The operating capacity, nominal capacity, 2024-25 enrolment and 2039 projection for Cunningham, Weir and MacCorkindale, and the staff statement that the three schools are projected to accommodate the projected enrolment for the next 14 years. ↩ ↩2 ↩3
-
VTCo, One school, three capacity numbers, one page, 19 August 2026. The earlier reading of the spread between nominal and operating capacity at a single school, which this piece does not repeat. ↩
-
Totals across the three receiving schools.
598 + 421 + 444 = 1,463 operating; 660 + 465 + 490 = 1,615 nominal; 428 + 379 + 294 = 1,101 enrolled; 408 + 318 + 284 = 1,010 projected for 2039Straight addition of the three rows published in the information session slides. The totals do not appear as totals in the source, and summing them assumes the three schools are the full receiving set, which the source states. ↩ ↩2 -
Ministry of Education, Long-Range Facilities Plan Guidelines, April 2019. The definitions of nominal and operating capacity, the statement that operating capacities vary between school districts because class sizes are negotiated locally, and the expectation that a long-range facilities plan covers ten years at a minimum. ↩ ↩2
-
Current enrolment against operating capacity, 75.3 per cent.
1,101 ÷ 1,463 = 0.7526, rounded to 75.3 per centRounded to one decimal place. No adjustment is applied for grade structure or programme type, and the figure describes the three schools together rather than any one of them. ↩ -
The 2039 projection against operating capacity, 69.0 per cent.
1,010 ÷ 1,463 = 0.6904, rounded to 69.0 per centRounded to one decimal place. It divides a projection by a present capacity, so it holds capacity constant for fourteen years, which the record does not state will hold. ↩ -
Decline in the projection across the claim period, 91 places.
1,101 − 1,010 = 91; 91 ÷ 1,101 = 0.0826, rounded to 8.3 per centThe difference between the 2024-25 enrolment and the 2039 projection for the same three schools, and that difference as a share of the current figure. ↩ -
The claim period counted forward: 2039.
2025 + 14 = 2039The staff statement covers the next 14 years and the district’s material names 2039 as the projection year, so the two are consistent. The arithmetic checks one published statement against another. ↩ -
Vancouver School Board, 2020 Long-Range District Overview, 2021 Update, May 2022. Board approval of the plan on 25 January 2021, enrolment data from September 2021, the ten-year planning horizon to 2031, the fifteen-year projections to 2036, and the title of Appendix E. ↩ ↩2
-
Vancouver School Board, Sir Guy Carleton closure engagement summary of 10 December 2025 and the closure questions page. That the projections extend fifteen years into the future, and the description of the model in use as Baragar plus local knowledge with projections currently to 2039. ↩
-
Distance between the published plan horizon and the projection year, eight years.
2039 − 2031 = 8The published long-range facilities plan states a ten-year horizon to 2031. The closure material describes projections to 2039. The subtraction compares two stated end years and says nothing about the quality of either projection. ↩ -
Vancouver School Board, Facilities Planning Committee agenda and enrolment report, 16 June 2025. The five projection sets with their producers and dates, the short, medium and long term horizons in use, the chart span from 2033 to 2050, and the published inputs of enrolment reports, the Vital Statistics BC birth registry and Canada Child Benefit recipient data. ↩ ↩2 ↩3 ↩4
-
Span between the earliest and latest projection sets in one report, thirteen months.
March 2024 to April 2025 = 13 monthsMeasured between the dates the report attaches to the Metro Vancouver set and the Baragar with Local Knowledge set. It measures the spread of vintages presented together and not the age of any single figure. ↩