Primary Sources The documents themselves, cited. Published Wednesdays.
Five projection sets, thirteen months apart
One Vancouver committee report of 16 June 2025 carries five enrolment projection sets from four producers. Their publication dates run from March 2024 to April 2025, and no record read states which set governs which determination.
A committee report is meant to give a board one view of the future. The Vancouver report of 16 June 2025 gives it five, and does not say which one governs.
Five sets in one report.
The Facilities Planning Committee report of 16 June 2025 presents five enrolment projection sets for the same district. They are named in the report with their producers and their dates, and the report was written by Jessie Gresley-Jones, Executive Director of Facilities, and James de Hoop, Senior Manager of Planning1.
| Projection set | Producer | Date carried in the report |
|---|---|---|
| Metro Vancouver | Metro Vancouver | March 2024 |
| Baragar Baseline | Baragar Systems | November 2024 |
| MECC | Ministry of Education and Child Care | December 2024 |
| BC Stats | BC Stats | February 2025 |
| Baragar with Local Knowledge Added | Baragar Systems, with district local knowledge | April 2025 |
Five sets. Every one of them describes the same district, over overlapping periods, in the same document.
A projection set is a working input rather than a background note. In this district’s records the figures carry capital plan submissions, seismic and replacement priorities, catchment work and the enrolment case inside a closure report. A set has to be picked before any of those arguments can begin, and the pick is what the record below is counted against.
Four producers behind five sets.
The producers do not run one to one with the sets. Baragar Systems appears twice, once as a baseline and once with district local knowledge added, so five sets come from four producers21.
Two of the four producers are governments. The Ministry of Education and Child Care and BC Stats are provincial. Metro Vancouver is a regional federation. The fourth is a commercial vendor, and its second set is a joint product with the district itself1.
That distribution matters to what the five sets are. Three of them are external estimates of the same population by bodies that do not run the schools. One is a vendor baseline. One is the vendor baseline after the operator has added what it knows.
The four also differ in what they count. A provincial or regional demographic projection estimates a population living in an area. A district enrolment projection estimates children attending district schools in that area. The two quantities move together and they measure different things, and no record read states how the report converts between them or whether it does.
Thirteen months between the oldest and the newest.
The five dates span from March 2024 to April 2025, which is thirteen months31.
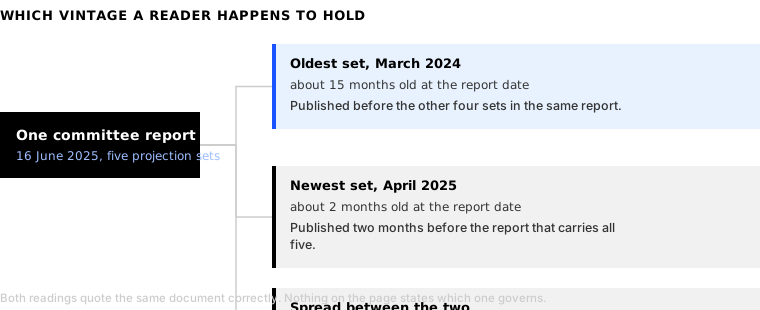
On the day the report was tabled, the sets carried five different ages4.
| Projection set | Date carried | Months old at 16 June 2025 |
|---|---|---|
| Metro Vancouver | March 2024 | about 15 |
| Baragar Baseline | November 2024 | about 7 |
| MECC | December 2024 | about 6 |
| BC Stats | February 2025 | about 4 |
| Baragar with Local Knowledge Added | April 2025 | about 2 |
The report carries the month rather than the day for each set, so every figure in the last column is accurate to within a month.
The horizons, already counted in this record.
The same report runs three planning horizons at once: a short term of the next three years, a medium term described as a 10 to 15-year horizon, and a long term described as a 15 to 30-year horizon, with charts spanning from 2033 to 20501.
The published long-range facilities plan states a different horizon again. Its enrolment data is from September 2021 and its projections run to a ten-year planning horizon to 2031, with some district projections carried to 20365. The Ministry guidelines set the floor: a long-range facilities plan is expected to cover a 10-year timeframe, at a minimum6.
The 2025 closure cycle used a projection set running to 20397, and the engagement summary of 10 December 2025 states that the Baragar plus local knowledge projections only extend to 15 years into the future8.
Primary Sources of 26 October counted the horizons in use and the record of 2 September set the closure horizon against the published plan910. Those counts are settled and are carried here without repetition. What this piece adds is the vintage column: between the nearest published horizon, 2031, and the furthest chart, 2050, sits a span of nineteen years11, and the five sets that fill it were produced across thirteen months by four bodies.
Where a projection set meets a decision.
The five sets are working inputs, and the record shows where one of them landed. The 2025 closure cycle at Sir Guy Carleton carried projections of the three receiving schools to 2039, and staff stated that those schools are projected to be able to accommodate the projected student enrolment for the next fourteen years7.
The engagement summary of 10 December 2025 states the limit of the set that produced those figures: the Baragar plus local knowledge projections only extend to fifteen years into the future8. That is the newest of the five, dated April 2025 and about two months old when the June report was tabled4.
So a determination taken in December 2025 rested on figures from one of the five sets, and the committee report carrying all five had been tabled six months earlier. No record read states that a choice among the five was made, on what basis, or by whom. The set that governed is identifiable from its horizon rather than from any sentence naming it.
What the record publishes about the method.
The inputs are named. The district describes actual enrolment reports, the birth registry from Vital Statistics BC, and Canada Child Benefit recipient data, run through what it calls a Population-Based Participation Rate Model1.
No record read publishes the model itself. Baragar is proprietary software, and no algorithm, parameters or reproducible specification appears in any record read1. Primary Sources of 7 October set out what follows from that, and it applies unchanged here12.
So the vintage question and the method question stack. A reader holding one of the five sets can date it and can name its inputs. On the published record that reader cannot reproduce it, and cannot reconcile it against any of the other four.
The two questions compound in one direction. If the five sets could be reproduced, a difference between them could be traced to a difference in assumptions. If they shared a base date, a difference between them could be traced to a difference in method. On the published record neither trace is available, so a difference between two of the five stays a difference and nothing more.
What no record read states.
- Which of the five sets governs which determination: a capital request, a closure analysis, a catchment change or a surplus finding.
- Whether the five were reconciled against each other, on what basis, and by whom.
- A common base date, so that the five could be compared on the same footing.
- Whether any of the five has been superseded since 16 June 2025, seventeen months ago as at the date of this piece13.
- The participation rate carried inside the model that produces the district’s own figures.
Each of those absences is a property of the published record rather than a claim about anyone’s practice. The five sets are printed together with their producers and their dates, which is the reason the count above is possible at all. A district that published one set would give a reader less to check. No more than that.
This piece counts sets, producers and dates. It compares no numerical projection against any other, because a comparison of that kind would need a common base date and none is published. It reads one district’s report on one date, and a second district’s committee papers would have to show the same distribution before the distribution could be called usual.
One column in the table the report already prints.
Beside each projection set, the determination it governs, and the date the set was produced.
That column adds nothing to the arithmetic and costs nothing to write, because both facts are already in the document. It states which of five sets a decision is resting on, at the moment the decision is taken rather than afterward.
A second line would carry the base date each producer worked from, so that a reader comparing two of the five knows whether the difference between them comes from a different method or from a different starting point. That line would have to be requested from four producers once, and printed thereafter.
Neither line changes a projection. Between them they settle which of the five a reader is checking, which at present is a guess.
Every figure above carries its source, every date is quoted from the record that prints it, and the arithmetic is shown at the end.
Sources
-
Vancouver School Board, Facilities Planning Committee agenda and report, 16 June 2025, Jessie Gresley-Jones, Executive Director of Facilities, and James de Hoop, Senior Manager of Planning. The five projection sets and their producers and dates: Metro Vancouver March 2024, Baragar Baseline November 2024, MECC December 2024, BC Stats February 2025, and Baragar with Local Knowledge Added April 2025; the three planning horizons in use and the charts spanning 2033 to 2050; the named inputs of actual enrolment reports, the Vital Statistics BC birth registry and Canada Child Benefit recipient data; the Population-Based Participation Rate Model; and that no algorithm, parameters or reproducible specification is published. ↩ ↩2 ↩3 ↩4 ↩5 ↩6 ↩7
-
Producers behind the five projection sets: four.
5 sets − 1 set from a producer already counted = 4 producersBaragar Systems produces two of the five sets, one baseline and one with district local knowledge added. The count treats the two as one producer and establishes nothing about how the two sets differ. ↩ -
Spread between the oldest and newest projection set: thirteen months.
March 2024 to April 2025 = 13 monthsThe report carries months rather than days, so the spread is accurate to within a month. It measures publication dates and says nothing about the base years the sets use. ↩ -
Age of each set on the day the report was tabled, in months.
to 16 June 2025: March 2024 = about 15; November 2024 = about 7; December 2024 = about 6; February 2025 = about 4; April 2025 = about 2Each figure is the distance from the month printed in the report to the report date. The report gives months rather than days, so each is accurate to within a month. ↩ ↩2 -
Vancouver School Board, 2020 Long-Range Facilities Plan, District Overview, 2021 Update, May 2022. That the enrolment data in the plan is from September 2021, the stated ten-year planning horizon to 2031, the note that some district projections run to a fifteen-year horizon to 2036, and the status of the 2020 plan as the current one. ↩
-
Ministry of Education, Long-Range Facilities Plan Guidelines, April 2019. The Ministry expectation that a long-range facilities plan cover a ten-year timeframe at a minimum. ↩
-
Vancouver School Board, Proposed Closure of Sir Guy Carleton Elementary School, report of the Superintendent, Special Board Meeting Agenda (Revised), 17 December 2025. That the 2025 closure cycle relied on a projection set running to 2039. ↩ ↩2
-
Vancouver School Board, Sir Guy Carleton closure consideration, engagement summary report, 10 December 2025. The statement that the Baragar plus local knowledge projections only extend to fifteen years into the future. ↩ ↩2
-
VTCo, One district, four horizons, Primary Sources, 26 October 2026. The count of planning horizons in use across the district’s records, and the reading of the committee report’s three horizons against the published plan. ↩
-
VTCo, Eight years past the published horizon, Primary Sources, 2 September 2026. The distance between the horizon of the published long-range plan and the horizon of the projection set used in the closure cycle. ↩
-
Span between the nearest published horizon and the furthest chart: nineteen years.
2050 − 2031 = 19The first figure is the published long-range plan horizon and the second is the far edge of the charts in the June 2025 report. The span measures the distance between two stated endpoints and establishes nothing about the reliability of either. ↩ -
VTCo, Published inputs, an unpublished model, and one number, Primary Sources, 7 October 2026. The named inputs, the proprietary model, and the absence of any published participation rate or reproducible specification behind the district’s projections. ↩
-
Time since the report that carries all five sets: seventeen months.
16 June 2025 to 18 November 2026 = 17 months and 2 daysMeasured to the date of this piece. It establishes elapsed time and not whether any set has been revised since. ↩