Primary Sources The documents themselves, cited. Published Wednesdays.
A source and a date on every figure
School Guide states one discipline: every answer carries a public source and a date.
The launch item for School Guide states the discipline in one sentence. “Each answer carries a public source and a date, so the record behind it stays visible.”1 Everything below is that sentence applied to a small piece of ground.
The three schools are Cunningham, Weir and MacCorkindale, the elementary schools named to receive students from the Sir Guy Carleton catchment. Their figures were published together, on one slide deck, on 28 October 20252.
One table, five figures per school, one date.
| School | Operating capacity | Nominal capacity | Enrolment 2024-25 | Projected 2039 |
|---|---|---|---|---|
| Cunningham | 598 | 660 | 428 | 408 |
| Weir | 421 | 465 | 379 | 318 |
| MacCorkindale | 444 | 490 | 294 | 284 |
| Total | 1,463 | 1,615 | 1,101 | 1,010 |
Every figure in that table comes from one record with one date2. The totals are additions of the published rows3. The projected total falls 91 places against present enrolment, a decline of 8.3 per cent over fourteen years4.
District staff stated that the three schools “are projected to be able to accommodate the projected student enrolment for the next 14 years”2. Fourteen years from the 2025 statement reaches 2039, which is where the projection set ends.
Two capacity figures for one building.
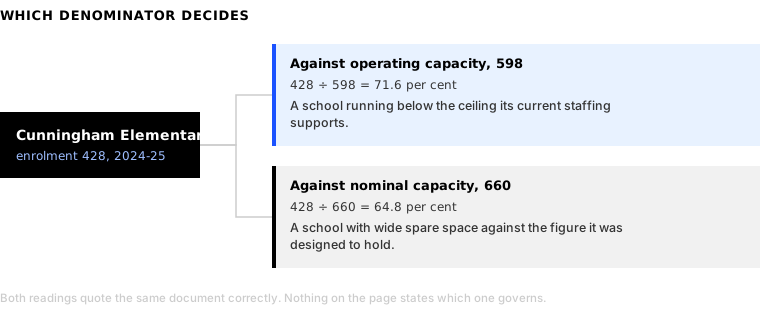
Each school carries two capacities, and both are correct. The closure report defines them at page 4. Nominal capacity is “the number of students a school was originally built to hold, based on its physical layout.” Operating capacity is “the number of students the school can currently support, considering how spaces are used and the required staffing levels.”5
Divide one enrolment by each and the same school reads two ways. Cunningham runs at 71.6 per cent against operating capacity and at 64.8 per cent against nominal, a spread of 6.8 percentage points on one day’s figures6.
The rule that separates the two figures.
The separation is written down, in Ministry documents, and it is a rule rather than a ratio.
Nominal capacity is a design constant. The Ministry builds it from “a notional number of students for hypothetical classes”, set at 20 students for Kindergarten and 25 students for grades 1 to 12, and applies it “only to determine the space allocation for that school”7. The Area Standards carry the same per-space figures at §2.2.18.
Operating capacity is a bargained variable. The Ministry defines it as “the number of students that it may accommodate, based on the maximum number of students for which teachers may be responsible for in an instructional setting,” and then states the derivation: “class sizes are negotiated as a working condition for teachers in their local contract with a board of education. As such, operating capacities vary between school districts.”7
The Vancouver School Board states the same rule in its own plan: “the operating capacity of a school is determined by adjusting its nominal capacity to reflect class size, based on class size limits in the local collective agreement.”9 The Area Standards state it at §2.2.2 as an adjustment “to reflect grade structure and classroom student capacity,” and carry a worked example in which a nominal 40 Kindergarten and 275 elementary becomes an operating 38 and 2568.
The consequence is exact. The same building, moved across a district boundary, keeps its nominal capacity and changes its operating capacity, because a different bargaining unit settled a different class size. There is no closed-form conversion between the two.
The ratio that holds at three schools and travels no further.
At these three schools, operating capacity sits at 90.5 to 90.6 per cent of nominal10. The consistency is real and it is local. It follows from the grade structures of these three particular elementary schools, and a district-wide conversion factor has not been published.
Recording the ratio without recording that limit would turn a local artefact into a rule of thumb, and a rule of thumb applied to a school with a different grade structure produces a wrong number with a confident face on it. So the ratio is printed here with its boundary attached.
A figure with no date carries no meaning.
Dates do the same work for costs: the holding cost on the vacant Sir Guy Carleton buildings is stated as roughly $65,000 per year, or $650,000 to date, at page 3 of the closure report of 17 December 2025, and on the information session slides of 28 October 202552.
The Facilities Planning Committee report on the same site, dated 7 June 2023, carries no holding-cost figure at all11. It carries a repair estimate of $8 million to $10 million and no annual cost of continuing.
So the pair of figures is true of the 2025 cycle and untrue of the 2023 one. A record that prints “$65,000 a year” without its date invites a reader to assume the figure was available when the earlier decisions were taken. It was not published then. That is the difference a date makes, and it is the reason each figure in School Guide carries one1.
Five domains, one geography.
School Guide is the public surface of the Social Infrastructure Database, which holds five domains on the same geography: education, housing, health, transit and community12. The school question is rarely a school question on its own. A family weighing a catchment is weighing a commute, a clinic, a park and a price, and those five records are published by five different bodies on five different cycles.
Putting them on one geography does not merge them. Each figure keeps the name of the body that published it and the date it was published, which is what allows a reader to notice when two of them disagree.
Reconciliation is the ordinary work behind that, and the three schools above were straightforward, because one publisher issued all twelve of their figures on one day. A family comparing a school in one district against a school in another is reading two publishers on two cycles, and the figures will have been struck months apart under capacity rules settled in two different collective agreements. Holding both, with both dates showing, is the whole task.
The coverage claim, and its receipt.
The newsroom item of 1 July 2026 states that School Guide is “[n]ow officially available across Metro Vancouver”1. That is the coverage on the published record, and this piece states it and no more.
A wider claim is a completeness claim, and completeness has two parts that are often confused. Catalogue completeness asks how many schools in a named authoritative directory have a record. Metric completeness asks how many of those records hold an enrolment, a capacity, a seismic rating or a programme list. A record can exist for every school while capacity remains unpublished for many of them.
Neither count is published with a directory name and a snapshot date, so both stand as an open gate below, and no figure for either appears in this piece13.
What the record does not do.
Nothing above ranks a school. The two utilisation readings for Cunningham are printed together precisely because choosing between them belongs to whoever is making a decision, and the weightings that decide it, distance, programme, siblings, capacity, belong to the family or the board making the choice.
Every figure above carries the body that published it and the date it was published, and the arithmetic is set out at the end so a reader can repeat it or reject it. Start with the school closest to home, and check its figures against what you thought they were.
Sources
-
The Visual Thinking Company, VTCo introduces School Guide, a free tool for Metro Vancouver’s school and neighbourhood questions, newsroom, 1 July 2026. The stated discipline that each answer carries a public source and a date, the fields named in the launch item, and the published coverage statement that the tool is now officially available across Metro Vancouver. ↩ ↩2 ↩3
-
Vancouver School Board, Sir Guy Carleton closure consideration, public information session slide deck, 28 October 2025. Operating and nominal capacity, 2024-25 enrolment and the 2039 projection for Cunningham, Weir and MacCorkindale, the statement that the three schools are projected to accommodate enrolment for the next fourteen years, and the maintenance pair of $65,000 per year and $650,000 to date. ↩ ↩2 ↩3 ↩4
-
Column totals for the three receiving schools.
598 + 421 + 444 = 1,463 operating; 660 + 465 + 490 = 1,615 nominal; 428 + 379 + 294 = 1,101 enrolled; 408 + 318 + 284 = 1,010 projectedAdditions of the four published rows. The source publishes the rows; the totals are computed here. They assume the three schools are the complete receiving set, which is what the slide deck states. ↩ -
Projected decline across the three schools to 2039: 91 places, 8.3 per cent.
1,101 − 1,010 = 91; 91 ÷ 1,101 = 0.0826, rounded to 8.3 per centThe difference between present enrolment and the projected figure at the end of the projection set. It measures the projection, not an outcome, and the underlying model is proprietary, so the figure cannot be reproduced from published inputs. ↩ -
Vancouver School Board, Proposed Closure of Sir Guy Carleton Elementary School, report of the Superintendent, Special Board Meeting Agenda (Revised), 17 December 2025. The definitions of nominal and operating capacity at page 4, and the maintenance figure of roughly $65,000 per year, or $650,000 to date, at page 3. ↩ ↩2
-
Cunningham utilisation, read two ways: 71.6 per cent and 64.8 per cent.
428 ÷ 598 = 0.7157, rounded to 71.6 per cent; 428 ÷ 660 = 0.6485, rounded to 64.8 per centThe same enrolment divided by each published capacity figure. Both divisions quote the source correctly. The spread of 6.8 percentage points is the whole reason a utilisation figure needs to name its denominator. ↩ -
Ministry of Education, Long-Range Facilities Plan Guidelines, April 2019, published as Appendix O to the Vancouver School Board Long Range Facilities Plan. Nominal capacity as a design figure built from notional class sizes of 20 for Kindergarten and 25 for grades 1 to 12, operating capacity as the number a school may accommodate given the maximum a teacher may be responsible for, and the statement that operating capacities vary between school districts because class sizes are negotiated locally. ↩ ↩2
-
Ministry of Education, Area Standards, May 2012, sections 2.2.1 and 2.2.2. Nominal capacity per instructional space, the rule that operating capacity is determined by adjusting nominal capacity to reflect grade structure and classroom student capacity, and the worked example converting a nominal 40 Kindergarten and 275 elementary to an operating 38 and 256. ↩ ↩2
-
Vancouver School Board, 2020 Long Range Facilities Plan, District Overview, 2021 Update, May 2022. The district’s own statement that operating capacity is determined by adjusting nominal capacity to reflect class size, based on class size limits in the local collective agreement. ↩
-
Operating capacity as a share of nominal at each of the three schools: 90.5 to 90.6 per cent.
598 ÷ 660 = 0.9061; 421 ÷ 465 = 0.9054; 444 ÷ 490 = 0.9061Rounded to one decimal place. The consistency is an artefact of the grade structures of these three elementary schools. No district-wide conversion factor has been published, and applying this ratio to a school with a different grade structure has no support in any record read here. ↩ -
Vancouver School Board, Consideration of Closure of Sir Guy Carleton Elementary School, Facilities Planning Committee agenda, 7 June 2023. The repair estimate of $8 million to $10 million, and the absence of any holding-cost figure in the 2023 report on the same site. ↩
-
The Visual Thinking Company, School Guide. The tool itself, and that it is published free at a public web address as the surface of the Social Infrastructure Database. ↩
-
Open gate: the coverage receipt has not been located. School Guide coverage receipt: the named authoritative school directory and its date, the count of indexed records on a stated snapshot date, the categories included and excluded, and the counts holding enrolment, capacity, seismic and programme data [no public URL located]. Not located in this pass. The published coverage claim remains the launch statement for Metro Vancouver, and no authoritative directory receipt with a snapshot date and a completeness metric was found. No school count is printed. ↩